
")


Optimization of fermetnation processes
This offer is intended for researchers and manufacturers of preparations for vaccines, probiotics, yeast and any areas of biotechnology, which work with living cells and for other producers of microbiological products. It was given in the Word and the Excel programs as a visual aid for your opportunity to quickly assess the effectiveness of your process using our theory and data from the software.
The periodic fermentation processes or processes of fermentation with addition of substrates (batch and fed-batch) can be explored using the software.
The input data are the biomass concentration; it can be expressed in any units, as well as the concentration of products and substrates. If the substrates are added during the process, you should summarize their original values and to make the entering into the software with the amounts received by this way in the product field (not in the "Substrate" field in the software), and bearing in mind not the concentration, but the numbers of the substrates that was already consumed up to this process time.
General theoretical description of the models given in the article, which have already been sent to you earlier: http://iopscience.iop.org/1758-5090/3/4/045006/
A typical S-shaped growth curve of biomass is shown in Figure 1:
The blue dots is an experimental values of biomass, Xexp. The blue curve is a model for biomass, X.
The red line is a model calculation for non-dividing cells concentration, cells of zero age state, Xst.
The green lineis a model calculation for concentration of dividing cells, Xdiv.
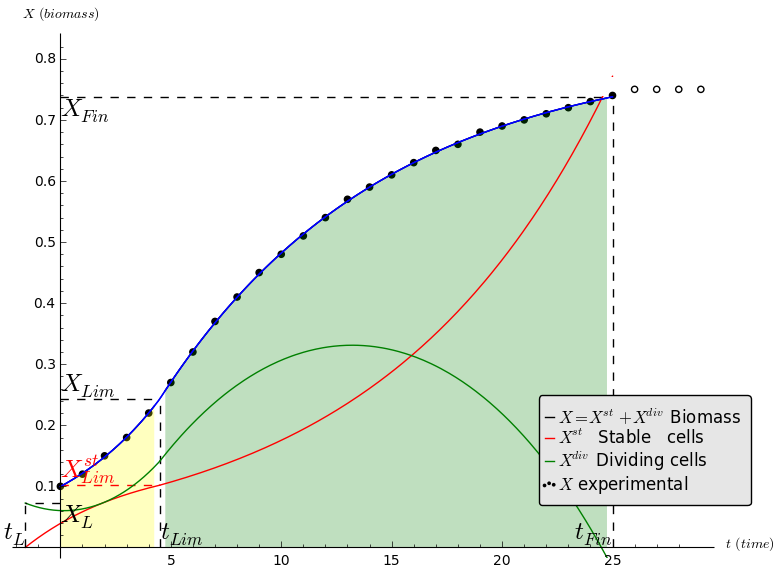
Figure 1. A typical S-shaped growth curve of biomass. The units are arbitrary.
A typical substrate consumption curve is shown in Figure 2:
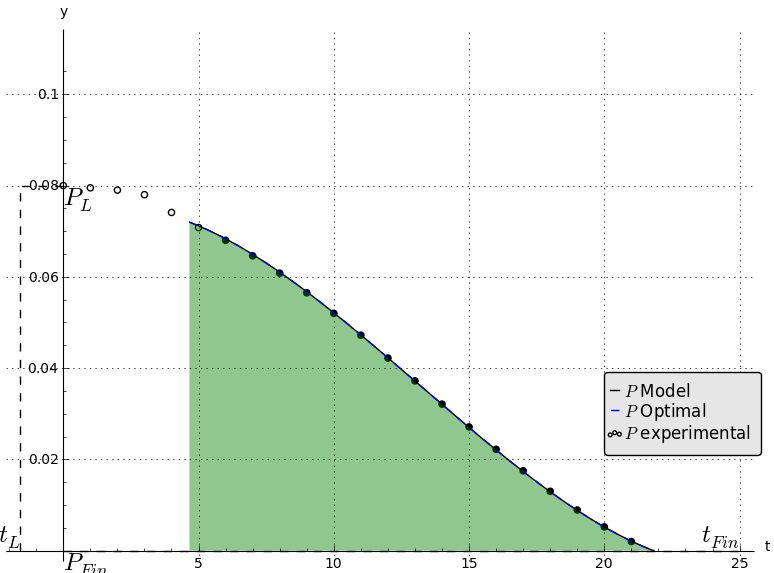
Figure 2. Typical consumption curve for substrates. The units are arbitrary.
A typical curve synthesis for products is shown in Figure 3:
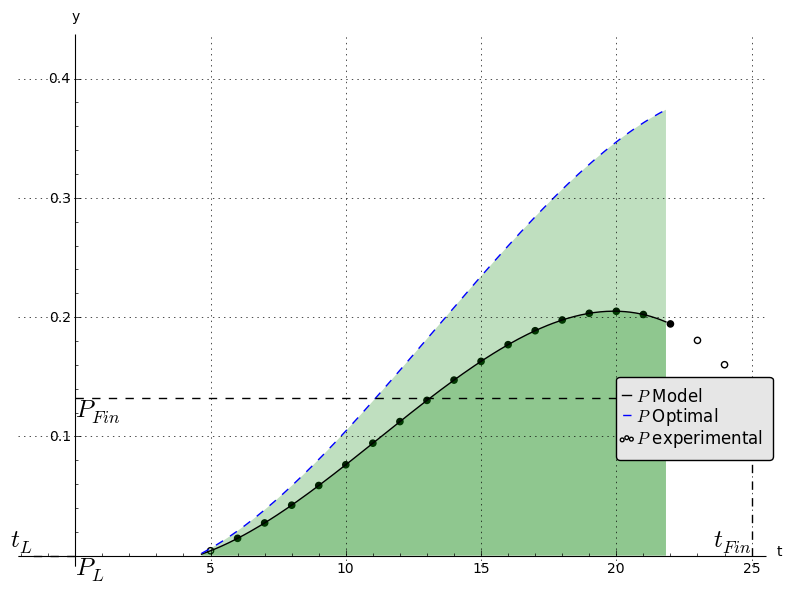
Figure 3. A typical curve synthesis products. Units are arbitrary.
The dashed line in the Figure 3 mean forecast for the product synthesis, if negative processes of deterioration of the product due to the lack of any nutrient components contained in this product for cells growth were prevented, but at the same time this component is as a main limiting factor in the nutrient medium.
To optimize the release of living cells at the obtaining of vaccines, probiotics, yeast R = Xst/X was used as the most important parameter. It is the percentage of non-dividing cells. For example, if we do not take into account this indicator, workers are often finishing the processes before that time, when all cells was divided and Roptimal = 1.
One of the main provisions in our experience could be formulated as: any biosynthesis involves in fact two processes - "positive " and " negative ". We assume that metabolites are synthesized only by proliferating cells. Non-proliferating cells, as a rule, destroy these products. Therefore, the signs of the constants for metabolite synthesis and degradation are opposite. The same should be stated for any substrates utilized for cell construction. All these can give a "separation" of these two processes and make recommendations to increase economic efficiency. Our mathematical model gives to physiological similarity of cultures in different volumes, as a criterion for different scale up procedures. This similarity is equal (or close) to ratio between of the dividing cells and non-dividing cells numbers for two (three, etc.) various volumes, which will be compared between each other: 10 liters, 1 cubic meter, etc. This indicator is marked with "R" in our articles.
Our software will help you solve the following tasks:
- modeling of your fermentation process data;
- predicting of the optimal processes;
- detecting of the limiting substrates according to 'a' and then to do all the calculations to achieve forecasts 'b'.
The software is appropriate for calculations of all S-shaped curves for all batch processes.
Please note:
- The data for the biomass should be as S- shaped curves (!)
- The software minimal quantity of dots for a biomass, X=f(t), should be equal no less than 8. (~4 dots for Exponential Phase of the growth curve and ~4 dots for Slow Phase.)
- The stationary growth phase has a little significance for our software. If you have doubts about your data, please, check them through charting in the Excel program.